These are a few of my..
Here I'd like to list some of my favourite indicators
Natural indicators:
- Trendlines : On a daily or weekly chart
- Fibonacci retracement levels : To find long or short term support and resistance levels. These are especially important when trying to catch a stock that is on it's way up from a downtrend.
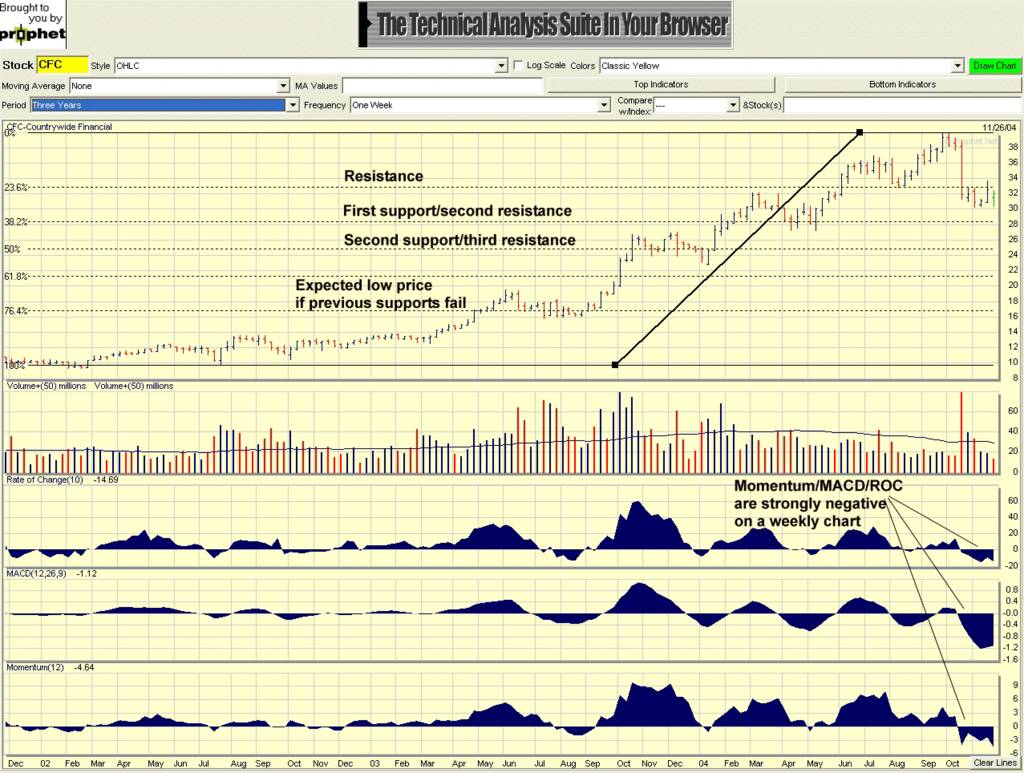
Not in any order of preference, a weekly chart showing all three indicators.
- MACD histogram
- Momentum
- ROC
Of course these dont take volume into account so that is something I need to monitor too.
There are pros and cons of using a weekly chart. The advantage is that I can get a good idea of the mid-term trend, while not being whipsawed by the daily price ups and downs. The disadvantage is that the stock price will usually drop a lot before I get out of a long position.
Another disadvantage is that they wont work well in "flat" markets. And that is another reason not to solely use these indicators.
Stock Screeners
There are a few custom screens that I use to find interesting stocks using MSN Custom Stock Screener. I'll post some of these at a later date when I figure out how to post custom screens. These will only work with Internet Explorer.
posted by pani5ue @ 5:03 PM
0 comments
![]()
![]()

0 Comments:
Post a Comment
<< Home