Tuesday, November 30, 2004

Some very interesting comments..

Recently I asked a senior of mine from undergrad school, who now works in the finance industry for some comments. He writes and I quote:

"
After looking at your weblog, this is what I think:

- Making notes of your daily trades and keeping records of the reasons why you entered into those trades is a really great habit. It will definitely help you in the long run. Keep on doing this even when the number of securities in your portfolio increases significantly.

- I liked the fact that most of the time, you support your technicalanalysis with some fundamental analysis about the company and overall macroeconomic analysis. keep on doing that. sometimes technical and fundamental indicators will show you different results. never get into a trade where the two indicators dont agree. in other words, dont try to give yourself a fundamental reason based on what the technical indicators are saying.

- Are you maintaining a P&L sheet also? Make sure that you maintain a record of P&L of every trade and keep a record of the txn cost also. Try to mark-to-market on a fortnightly or monthly basis. I notice that almost 80% of your trades are individual equity trades. Based on my experience, a typical individual investor pays a whole lot of money in txn costs. I'd encourage you to do your P&L from day 1 when you started trading and then see how much did you pay in txn cost.

- One important thing that I notice is that most of your investments are in equities or equity derivatives. Do you invest in other asset classes like bonds, mutual funds, index funds etc too? One should also take care of asset allocation (dividing up the portfolio into various asset classes) before doing individual security selection. In the present environment, a lot of people are getting into non-equity investments.

- I noticed that you wanted to get into currency trading and were looking for some sites. I haven't done short term currency trading but heard that oanda.com provides that. check that out.

- check out tradesports.com and hedgestreet.com. These two sites give you option to trade on certain macroeconomic trends like housing prices, fed futures rates etc.

- One suggestion is to look at index funds from firms like Barclays Global (ishares.com) or state street. They can give you an exposure to foreign markets, currencies, commodities etc. Even for US equities, its sometime better to invest in a whole sector/industry rather than investing in
individual stocks. index funds can give you that flexibility.

- most of the trades that you are doing are short term trades. try looking into some longer term trades too e.g. somebody who bought an index fund following Russell 2k at the start of this year might have made around 15% on their investment. Compare that with the net returns that you are making in short term trades and see which one is better for you.

- nearly all of your trades are expecting that a particular security will either go up or down. have you looked at the various option strategies (e.g.strangle, straddle etc)? They can help you make money even in flat markets.

you must have noticed that i am not giving you fundaes on your individual trades but more on your overall portfolio. The reason is bcoz most of the investors forget about the overall return picture and get too carried away with their individual trades. always keep an eye on what your portfolio is making after paying all the costs. thats what matters in the end and not the number of correct bets that you had.
"
Saturday, November 27, 2004

These are a few of my..

Here I'd like to list some of my favourite indicators

Natural indicators:
  1. Trendlines : On a daily or weekly chart
  2. Fibonacci retracement levels : To find long or short term support and resistance levels. These are especially important when trying to catch a stock that is on it's way up from a downtrend.
Artificial indicators:
Not in any order of preference, a weekly chart showing all three indicators.
  1. MACD histogram
  2. Momentum
  3. ROC
This is of course not the criteria for selecting but more of a confirmation to see whether the entry/exit point is correct. The way that I'd use them for example is this: For a long position, I'll try to initiate a position when all three indicators turn positive and get out of the position when two of them turn negative. Similarly, for a short position, I'll get in when all three indicators turn negative and get out when two of them turn positive.

Of course these dont take volume into account so that is something I need to monitor too.

There are pros and cons of using a weekly chart. The advantage is that I can get a good idea of the mid-term trend, while not being whipsawed by the daily price ups and downs. The disadvantage is that the stock price will usually drop a lot before I get out of a long position.

Another disadvantage is that they wont work well in "flat" markets. And that is another reason not to solely use these indicators.

Stock Screeners
There are a few custom screens that I use to find interesting stocks using MSN Custom Stock Screener. I'll post some of these at a later date when I figure out how to post custom screens. These will only work with Internet Explorer.

Friday, November 26, 2004

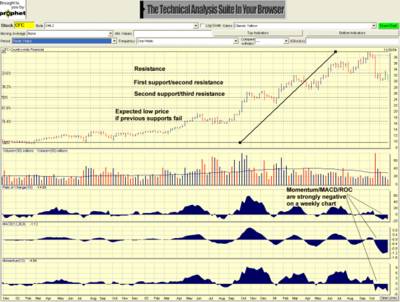
Trade: CFC April $25 Put @0.65

Bought CFC April $25 put @0.65 I expect to hold this till expiration if the downtrend is strong. Else I might trade near support-resistance levels, CFC was at 32.05 when I bought the option

Bought this today instead of the July put as I saw a relatively "cheap" quote. Also if there is any possible market weakness on Monday then CFC might be caught in it.

I'll possibly still buy the July options if the stock moves as expected; I might sell the April put near support and buy the July near resistance. Possibly not before Feb/March.


CFC long term chart Posted by Hello

Double trouble: CFC

I am considering a put position in Countrywide Financial. The company stock dived for the first time in a very long time. I think that this is the end of the refinance boom due to rising interest rates and this scenario will hurt CFC. Also with the dollar hitting new lows everyday, the possibility of a "faster than expected" interest rate hike remains high. The earnings growth for CFC which started in 2001 will decelerate in this scenario.

The second business that CFC is in - insurance. Spitzer had been suing other companies and he will eventually come to CFC.

The trade that I'm considering is a July put. That'll be good time for Spitzer as well as Greenspan to make their intentions clear.

Resistance:
  1. Around 33.11 (the curent 200-day MA)
  2. 34.35 : The high price of the gap-down on 10/20/2004
Support:
  1. Around $28 (May low/base support area)

Wednesday, November 24, 2004

Trade: XXIA

Bought 100 XXIA @14.10 Mental stop loss @12.8 in my IRA
2 XXIA December call @0.4 in anticipation of a major breakout. Hold till expiration

I am not sure what the tax rules are but if let's say that sometime the stock goes to 14.8 and I sell a call in my IRA. Then it closes at 14.9 and I let my brokerage calls expire worthless.. how will I be taxed? If anyone knows..

I am definitely going to pay more than I made to the tax man and his cronies (H&R block types)


Tuesday, November 23, 2004

Let the trades begin

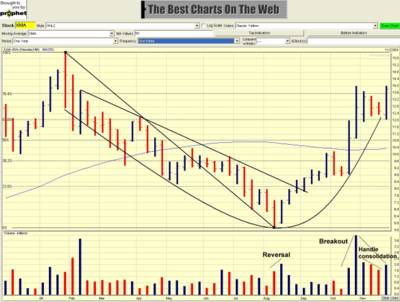
I opened an IRA yesterday and am ready to do some trading there. XXIA showed up on my volume surge screen and it staged a nice breakout today. The first breakout was after it reported earnings. The three week consolidation after that is good for the second breakout. What I like about stocks that breakout on good earnings is that the upgrades soon follow and really there's nothing to stop the momentum for at least a quarter.

I'll buy it tommorrow. I have a mental stop loss at around $12.8.


XXIA formed a cup-with-handle pattern and had a breakout Posted by Hello

Monday, November 22, 2004

Contrary to contrary opinion

Has anyone noticed how lots of "TV people" on CNBC are talking about contrarian indicators pointing one way or another? Contrarian indicators, in my opinion, work best when no one is paying attention to them, that is the essence of "contrary". When everyone is talking about the contrary, it then becomes public opinion and really a true contrarian would take the opposite of the view expressed by the "TV contrarians"

I guess the bursting bubble has made these contrarian indicators too popular and we now need either new indicators or possibly change our view of what really is contrary. Also, contrarian indicators rarely work in a trend. We are in a trend not at an extremity.

Two wrongs don't make a right. However, as a contrarian contrarian, one cannot not observe the negation of positivity on TV (yeah I don't know if it makes sense either)


Trade: Bought QQQ March 2005 $36 Put @0.80

I have done the first trade from the last post. Now I have to wait for the support levels to be hit.

March 2005 36 Put @0.80

The QQQ at that time was @38.6


Sunday, November 21, 2004

Trading cubes(QQQ)

Like I had written before, I am convinced the market is in an uptrend. The QQQ hit a new high on Thursday even though the NASDAQ still hasn't cleared that mark. Since the QQQ consists of the top 100 companies of the NASDAQ and it is slightly outperforming the index, it's a good sign. This brings us to the point where there should be a minor correction/consolidation. This is, in my opinion, the perfect setting for trend-trading. And I'll start doing just that on the QQQs, possibly starting Monday.

The scenario that I have in mind is as follows:
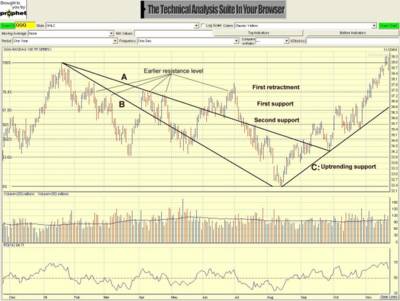
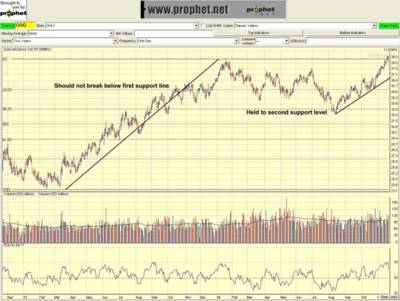
  • QQQ will retract to the 37.5 level and try to establish support there. That represents the first Fibonacci retracement from the high of this year. This is also close to the previous resistance levels from mid-February, April and July. This is also the support level expected from the trendline formed by the recent advance from mid-August.
  • If support holds @37.5 , then it'll advance again to a new high. If this happens I'll figure out the next resistance level. If support fails, then the next level of support is at 36.4, next at 35.7.Any fall below 36.4 will ring my alarm bells and a break below 35.7 would signal a definite reversal since it would have broken the up-trend line and also failed two support levels.
I have two trades in mind:
  1. Buy March QQQ puts @36 on Monday, Nov 22nd. This'll limit losses in case the first resistance doesn't hold.
  2. March/April QQQ calls : Will wait for the retractment to the first support level @37.5 and buy calls with a strike = $40 at the first sign of reversal.
Click on the charts to see bigger more readable versions with the support/resistance levels.


QQQ 1 year chart Posted by Hello


QQQ 2 year chart Posted by Hello

Some basic bedtime reading material on the subject of technical analysis:
http://www.stockcharts.com/education/TAindex.html
http://en.wikipedia.org/wiki/Technical_analysis

PS: I read recently a news-story that the QQQ name is being changed to QQQQ. So basically they changed the name from three-Q to ???? , whoever came up with THAT bright idea.. :)
PS1: If you still dont get it, read aloud.

Thursday, November 18, 2004

On your march..

More stocks on watch that are forming interesting patterns

RMBS : Nice breakout. Watching for the retractment to 18-19 level
AUO : Watching for 14.2(resistance) or 12.0 or 11.5 (two support levels)
SCH : 9.6-9.8
FDRY : No price target currently. More later.

More charts and stuff later. Drop me a note if you have opinions on which of these three is a better bet.

Also waiting for the end of the week for the options cycle to expire.

Tuesday, November 16, 2004

ERTS update

A few points reevaluating my EA trade. This is a position trade in anticipation of an event. So here are some more thoughts

  1. EA made a 3.5% jump today yesterday at slightly above average volume. This was, I guess in response to the news that EA is going to acquire DICE the maker of the Battlefield 1942 series (which by the way is a great game) . The stock is just hovering around the 200-day MA and closed barely above it before dropping back under it again today.
  2. Reevaluating the stock after the put dropped to 0.8 today I realized that the reasons I bought the put still hold. There's intense competition coming from Halo2, GTA3, Metal Gear Solid3 and Half-Life2, which I believe will be the blockbuster games for the end of year. These same games will eat into EA revenues despite the fact that EA dropped the price on some of it's games. I still believe EA will miss on the holiday sales number when it reports its next earnings.
  3. In the past year, there have been around 5 high volume drops in the stock price but none of them broke the 200-day average. The stock has recovered all those times. This time, however, it looks like the 200-day MA is providing stiff resistance looking at the 1 year chart.

Saturday, November 13, 2004

Patience, my dear

One of the things I am starting to appreciate is that you have to trade differently in different market conditions. In an uptrending market, the idea should be to buy on pullbacks and hold on advances. On the other hand in downtrending markets, the idea should be to sell on advances and definitely NOT HOLD on pullbacks. Essentially it means that if the market is trending downward, then if the stock wasn't sold off initially when the trendlines were broken, then the first advance should be sold. Of course the tricky part of the equation is to figure out whether the market is in an uptrend or a downtrend; something that I am kind of learning as I go along!!

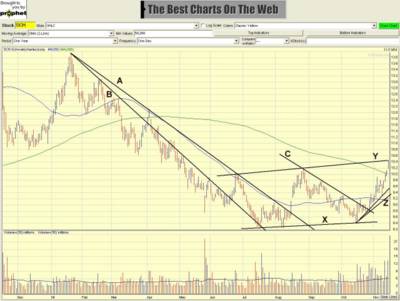
I've been talking about about technical trades, support and resistance levels. Charles Schwab recently has shown strength and formed some very interesting trendlines. I also recently figured out how to post images so here goes.. You can click and open the chart in a new window for a more readable version

  • A,B : Two differently drawn "long term" downtrend lines broke and formed support levels. The B downtrend was broken with very good up volume. The A downtrend also broke on above average volume but not very good compared to B
  • C: Short term downtrend lines were broken on above average volume
  • X: Support levels were formed during these volatile, violent movements
  • Y: Higher trending intermediate term resistance levels are being formed. Higher trending resistance levels will possibly act as support levels in the future if the stock breaks above it.
  • Z: The stock is still trying to find it's short term support levels in order to establish a solid upward trend. A good first guess would be the earlier first resistance level during C, which is between 9.6 and 9.8. A good second guess would be between 9.2 and 9.4
  • The stock has also broken above it's 200-day MA and should find support there.. which I think will coincide with the above two levels depending on how the stock moves in the next week.
I will enter an option trade since I am quite convinced that this is on an uptrend. I will wait for the first pullback to around the 9.6-9.8 level and buy:
  1. Either out of the money June 2005 @12.5 calls
  2. Or in the money June 2005 @7.5 calls for around $2.4-2.6


Charles Schwab Posted by Hello

So essentially waiting is what I'm going to do which is kind of hard when you're waiting for a pullback on a good trade. All you need is just a little patience..

Wednesday, November 10, 2004

Bought: ZONS @5.84

This is one of those chart patterns that I just can't resist. This is definitely an impulsive trade that showed up on one of my volume surge screens.

Even after it's quick advance, the stock seems to be richly undervalued, and has very low institutional ownership, leaving ample room to go up. Broadly speaking, it's a retailer which sells technology products to companies. The reason it's attractive is because it is showing good price strength, is profitable and undervalued

Also the price is now above $5 a very important level for the stock to show up on the institutional screen.

One the flip side, the stock has had a history of going dormant and declining slowly for extended time periods. I would consider this a short to medium term trade.

If the first round of buying has been from some institutions, we should see support at around 5 to 5.5

Sunday, November 07, 2004

Game over? ERTS : Bought Put 40 March 2005 @1.05

Even though I think the market to be in a bullish phase right now, I am ready to make a bearish bet on ERTS. Even though Electronic Arts is a great company, has some superb games and has shown incredible growth in the past,I'll write down why I think ERTS stock has topped for the intermediate term
  • There just aren't any compulsive games coming out. The craze last year and the year before was definitely for games. As a casual gamer, there were some games that I paid $50 for. Today I can't find any game that is persuasive enough for me to cough up that kind of money. Maybe a few like Halo2, GTA-3 and Half Life2, but anyway those are not ERTS games
  • Christmas is round the corner and there are a host of other gadgets that people can think of. If someone is a hardcore gamer, they have most likely played all the games this year that they wanted to. They have owned their XBOX or PS2 for a while now and possibly got either the console or a lot of games as gifts. For the casual gamer, if they didn't already buy it at $50, they probably bought their copy of "Allied Assault" or "GTA-Vice City" at a significant discount anyway. Possibly the same people got IPODs last year or bought one this year (Apple stock hasn't been soarin' for nothin'). What do you think a thoughtful gift-giver might decide to gift- another $50 game this year or a $50 gift certificate to itunes? A PS2 or an IPOD mini?
  • The new XBOX and PS2 consoles should be coming out not too far in the future. ERTS possibly has to spend a lot of money and time developing new games for those consoles rather than for the existing consoles expecting of course that the new games will be a league better than existing ones. Most new games coming this out will be slight variations of existing ones. I expect R&D expenses at ERTS to be up for the year.
  • ERTS missed expectations and guided lower in it's most recent quarter. December sales I think will be more disappointing than the company anticipates because of lower holiday sales.
  • Also the stock has 99% institutional ownership. When these institutions start unloading, it's going to be ugly. Also the short ratio is at only 4.3 days, not enough for any meaningful short covering to propel the stock higher.
  • Technically the stock has formed a classic topping pattern. The trendlines both longterm and shortterm have broken support lines and are now forming clear resistance lines. The downtrend over the from 1st July to now looks quite solid. It has broken support lines twice and this is the first time it's forming a downtrend. The stock had found support at around $48 earlier and now this same level is acting like resistance.
  • Right now if the stock doesn't break forcefully above the 200-day MA then the next support is at $44. If it manages to break below this level then there's a lot of possible downside.
  • Intraday supports also seem to be breaking and turning into resistance levels
I will watch the stock in the next few days for more confirmation from it's intraday price movements. I have initiated an out-of-the money "put" position strike price $40 @1.05 for March 2005. March is the earliest when the holiday results become available. Whether I hold on till expiration depends on the pattern that the stock shows over the coming few days/weeks.

Since one of my goals is not to have more than 10% of trading money in options, at this point, the only reason I'm initiating a put is because I want to limit the loss potential that short selling has. I also prefer staying off a margin account and trade with cash only for now.

Friday, November 05, 2004

Dollar bear

I have been thinking about this for a while and now that Bush is here for "four more years" I think even more strongly that the US dollar is now at a significant risk. I'm not really sure what I'm missing, but I don't really see currently how the total deficit is going to come down. Recently the dollar has fallen to a new low against the Euro and I think that this is just the beginning of a trend. Of course I have no formal knowledge of the complex interactions between currency, debt, interest rates, the stock market, policies and politics to come up with any argument one way or another which cannot be refuted.. In my simplistic view of the world, I like to think of a country as a company and it's currency in terms of it's stock; one can draw surprisingly close parallels between the two.
  • The net long term debt of of a company to the net deficit of a country
  • The revenue to GDP
  • The trade surplus to earnings
  • The "value" of it's currency to it's market cap or it's stock price.
When one looks at a company for valuation, one of the biggest red flags is increasing debt. Investors are usually fine with this if the company is expected in the future to use this debt to grow it's earnings at a pace faster than it's growing it's current debt, for example by building new plants or investing in R&D for new products; I believe this is the current world view of the dollar - that the current deficit will lead to higher returns later.

Since the dollar is a world currency, one of the most obvious ways for Bush to cut the deficit in half is to start printing more dollars. This is the part where the complex interactions come in. Printing more US dollars means the debt can be paid off with the newly printed dollars; however the value of the dollar decreases(company issues more shares, the debt per share decreases but so do the assets revenues and earnings per share). It means that the trousers "Made in China" are suddenly not so cheap at Walmart. Of course that'll also cause that the net imports from China to decrease.. eventually helping cut the deficit even more. But meanwhile inflation in the US has increased and the US consumer is buying less and less. On the other hand as interest rates rise, the debt(US deficit) becomes slightly more attractive since it's paying a higher rate of return(interest) which might start helping the dollar gain back ground. Actually at this point a lot of interactions become "alternate world scenarios".. somewhat like a chess game.

On the politics side of the alternate world, if Bush goes ahead with his private social security accounts, that's again something that'll bring a huge amount of money into mutual funds etc. Of course it'll help the financial companies but more importantly, all this new money into the market will helps boost the market a lot(adding to the net assets of the US). It might then become attractive again for foreign money to buy cheap US dollars, invest in the US market (causing a ripple effect in the market) and cause the market to go even higher. At the same time because of the US dollar buying, the dollar goes higher. All this depends not only on the extent of this privatization but also on the timing, both of which are political issues.

However if he keeps doing what he has been doing.. spending, which in my mind is the more plausible scenario, then there is nothing really to stop the falling dollar.

Recently there's been a lot of talk about rising oil prices. Let's take a step back from that and think in terms of the US dollar. In Nov 2003, 1 US dollar was about 1EURO . Today it's about 0.77 Euro. Oil went from about $28 to $50 during the same time. Whoa!

But wait, if we look at it again in terms of the Euro. It only went up from Euro 28 to Euro 38.5 . Suddenly that doesn't look as bad as the US prices rising, does it now? The Europeans "only" saw a 37% increase vs a 78% for the US, about half the increase the US saw. Are the US economists and financial gurus trying only to "hide away" or "hide from" what's truly out there by talking just about the oil prices on TV?

A lot of these really depends not only on the events themselves but the sequence of events. The directed graph picture in my mind right now has very few paths that lead to a stronger or sustained dollar and many more towards a weaker dollar. In the past few years we have seen the dollar bear come out of hibernation and sniffing for food. The question now is : will it attack those unsuspecting hikers?

PS: I have never really traded currency but it's probably about time. If someone has any recommendations or experiences for online trading sites with not a huge capital minimum, I'd appreciate it. Some of the European ETFs and international equity funds might add some protection so that's something I'll look at. The gold ETF is also something to explore although not really something I would like to do.
PS:I have also enabled anonymous comments so you don't have to register to leave a message.

Tuesday, November 02, 2004

IDC update - short covering

IDC caught some air today and has staged it's first breakout. I think this is the first of a short covering rally. There were still a million shares to cover as of 8th October so this could happen a few more times.

The longer term uptrend is also becomng clearer now.